Tel Aviv University Simulations
Simulations Conducted by Professor Rosenfeld from Tel Aviv University
Dr. Farb created the concept and Professor Moshe Rosenfeld of Tel Aviv University’s School of Engineering, a world expert in CFD, performed simulations. Dr. Farb filed the first patent based on this in 2008, which was granted in the US in 2012 (also granted in Israel, Canada, and South Africa; other countries pending and newer patents pending). Dr. Farb founded a company and rented land in the Negev Desert in an industrial park to test the concepts. We set up a small control and test turbine, performed simulations on the turbine, and came up with a design that, according to initial calculations, would improve the power output 8.3% in winds of 10 meters per second.

Figure 1: Computer Model of Wind Energizer
Figure 1 presents a computer model showing the placement of the original Wind Energizer in faint black adjacent to the turbine blades in faint white, with the colors showing the percentage increase in velocity in different places, red being the highest. The objective was to find the best way to place the turbine and the structure so that velocity would increase. Wind is from the left.
Results
We built it and started collecting data. The results were truly amazing. The Wind Energizer shifted the power curve 1.2 meters per second to the left, so that the cut-in speed (the speed at which a turbine starts to produce 1 watt) changed from 3 to 1.8 meters per second. A striking proof of the concept is a video showing the test turbine turning and the control not moving at wind of 2 meters per second. We ran them side-by-side for a day that had speeds from 0-7 meters/second, and the test turbine produced 156% more power. We have a letter from an independent electrical engineer who installed the recording systems that verifies these findings. (Place link to study here.)
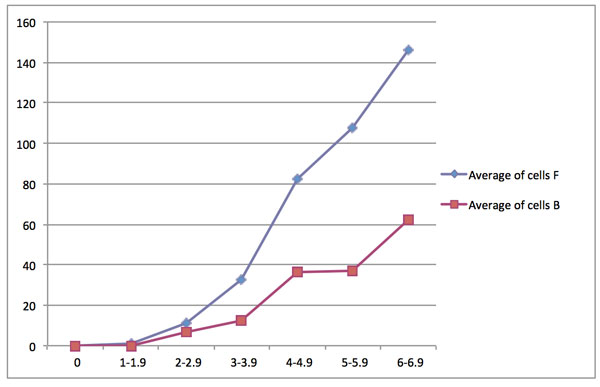
Figure 2
Figure 2 here shows the results of one run of data with 834 data points so the graph is not so smooth. B was the control and F was the test turbine. The x-axis shows wind speed, the y-axis shows watts, and the blue line is the power production of the turbine with the Wind Energizer.
The graph in Figure 3 summarizes the percentage effect on a test turbine’s power at different wind speeds. The percentage increase varies at different wind speeds because the effect of a power curve shift of 1.2 m/s is proportionately more effective for lower wind speeds. This has significance in expanding the market for wind turbines to many more parts of the world, particularly outside of the higher wind speed areas. This has the benefit of making wind energy accessible in more markets close to the point of greatest use where wind speeds are often less. This clearly overcomes shortcomings in the cost of wind energy and its performance in lower wind regimes, and enables less expensive and more secure transmission of energy to the users in large cities.
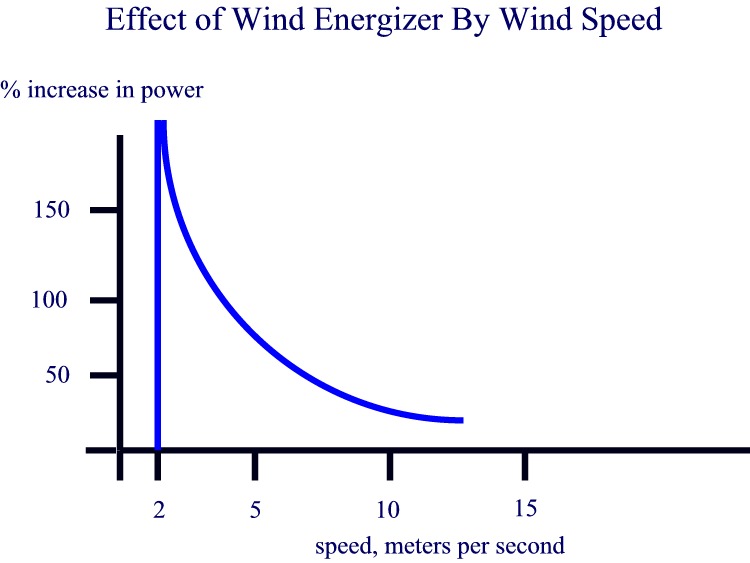
Figure 3
Why was the simulation so successful?
There are two answers.
First, we were testing in an area in which most wind speeds were mostly up to 6 meters per second, and only up to about 9 meters per second for short bursts of time late in the afternoon. The technology is much more effective on a percentage basis at low wind speeds. This is significant, as 6 meters per second is the average wind speed for most wind farms, and that is well within the range of the greatest effect of the Wind Energizer. Second, there is a distinction between theoretical and real wind. Real wind is gusty, and, because the Wind Energizer increases the effect of the gusts, real performance is much higher. When we adjusted our theoretical projections with allowance for gusts, we found a nearly perfect match between the theoretical predictions based on CFD modeling and the actual data.
Second, there is a distinction between theoretical and real wind. Real wind is an average of higher and lower wind. Because the Wind Energizer increases the effect of higher wind much more, real performance is much higher. When we adjusted our theoretical projections with allowance for averages, we found a nearly perfect match between the theoretical predictions based on CFD modeling and the actual data.
Here is a layman’s explanation:
Power is proportional to the velocity cubed. If the wind is a steady 3 meters per second, the figure for velocity cubed in the course of an hour is 3x3x3 = 27. If the wind averages 3 meters per second, but is half the time 0 and half the time 6, then we have the sum of 0x0x0/2=0 and 6x6x6/2=108. That is 4 times the amount of power because of the gusty nature of wind. Let us go back to steady state wind. If we shift the power curve by 1.2 meters per second, then, when the steady state wind is 3 meters per second for an hour, the real speed at the turbine blades with the Wind Energizer is 4.2 meters per second. 4.2×4.2×4.2=74, almost 3 times the amount of power even without gusts.
We have modeled many large wind turbines, and in general, the theoretical wind in our simulations leads to an increase of 20-40% in power output independent of gusts, which is twice that of our prototype. That suggests that the actual performance on a large scale will be much higher than what we found on a small scale.
Summary:
Our baseline is theory proven on a large scale, but implementation is proven so far only on a small scale. The barrier to commercialization of the technology is to prove implementation on a large scale because that is what the customers demand.
From a scientific point of view, there is no difference. It is a complex geometric problem.